
In 2020, Nike made a bold move based on what the data seemed to say.
Consultants flagged Nike’s top-performing customers as elite athletes and hardcore runners—the ones dropping $150 for performance shoes. So, Nike shifted its strategy to focus on that audience.
Sales tanked.
The problem? Those weren’t Nike’s most valuable customers. They were the loudest in the data.
The real revenue came from everyday athletes—the weekend joggers, casual gym-goers, and people who wore Nike to feel something, not do something.
The data didn’t lie, but it lacked context. Without context, insight turns into liability.
⚠️ That’s the trap of bad data-driven marketing. You think you’re being strategic, but you’re just being selective.
Let’s break down what data-driven marketing actually means and how to do it right.
Let’s Talk Real Data Strategy
Data-driven marketing isn’t about dashboards. It’s not about dumping numbers into a spreadsheet and hoping something useful pops out.
It’s about making every decision—audience targeting, creative, or media buying—based on real behavior, real performance, and real outcomes.
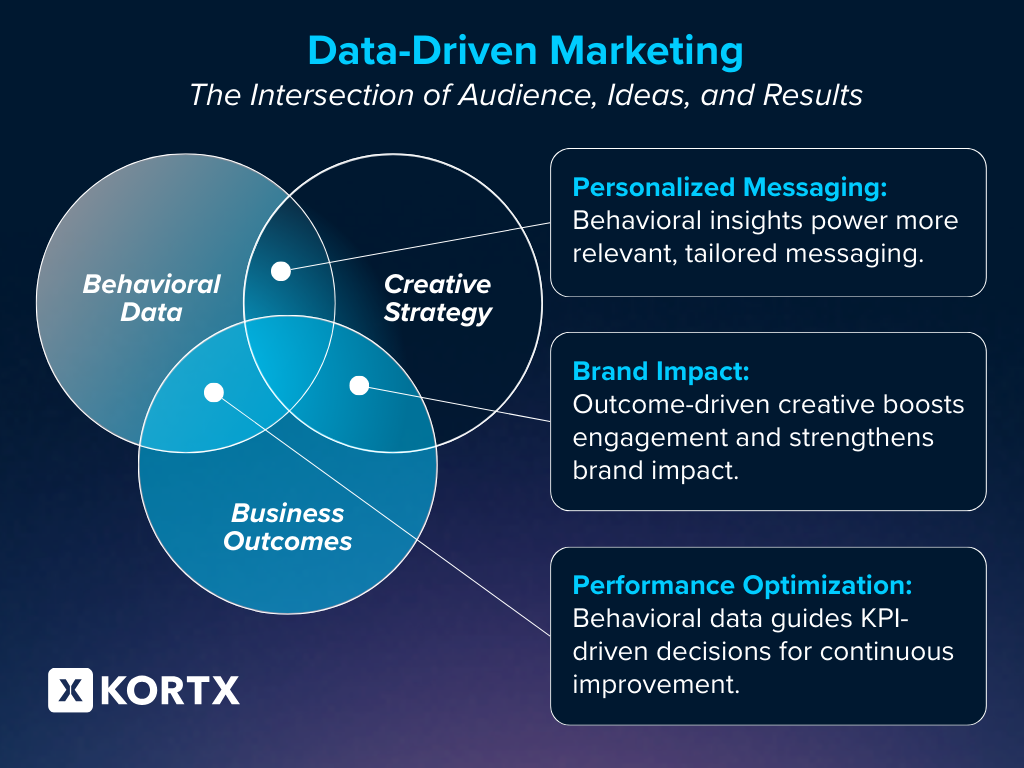
Data-driven marketing uses real-time behavior and insights to guide decisions—across campaigns, channels, and even business strategy. It replaces guesswork with precision.
Data-driven marketing informs who you reach, where you reach them, and how. The goal? Smarter targeting, stronger performance, and actual business results.
TL;DR: Data-Driven Marketing, Done Right
Most marketers say they’re data-driven. But without strategy, structure, and clarity, data becomes a distraction—not a performance driver. This guide breaks down what it actually takes to build smarter, insight-led campaigns.
Here’s what you’ll walk away with:
✅ A 7-part framework for real data-driven strategy—from goals to optimization
✅ How to connect creative, targeting, and performance without guessing
✅ Tips for turning reports into decisions (not just decks)
✅ Common traps to avoid—like vanity metrics, siloed data, and “data-driven dummy” mode
✅ Real examples of how KORTX helps brands use data with intent (and drive results)
Reading Time: ~16 minutes
Want to skip to the examples? Jump to results in action ↓
5 Non-Negotiables of Data-Driven Strategy
Data should drive action, shape strategy, inform decisions, and enhance campaign performance. Implementing these five principles ensures your marketing efforts are focused, agile, and built for impact.
1. Prioritize Audience Intelligence Over Assumptions
Start with actual behavior, not guesswork.
Use behavioral signals such as site activity, CRM actions, offline conversions to build profiles rooted in real intent. Segment based on intent rather than outdated personas.
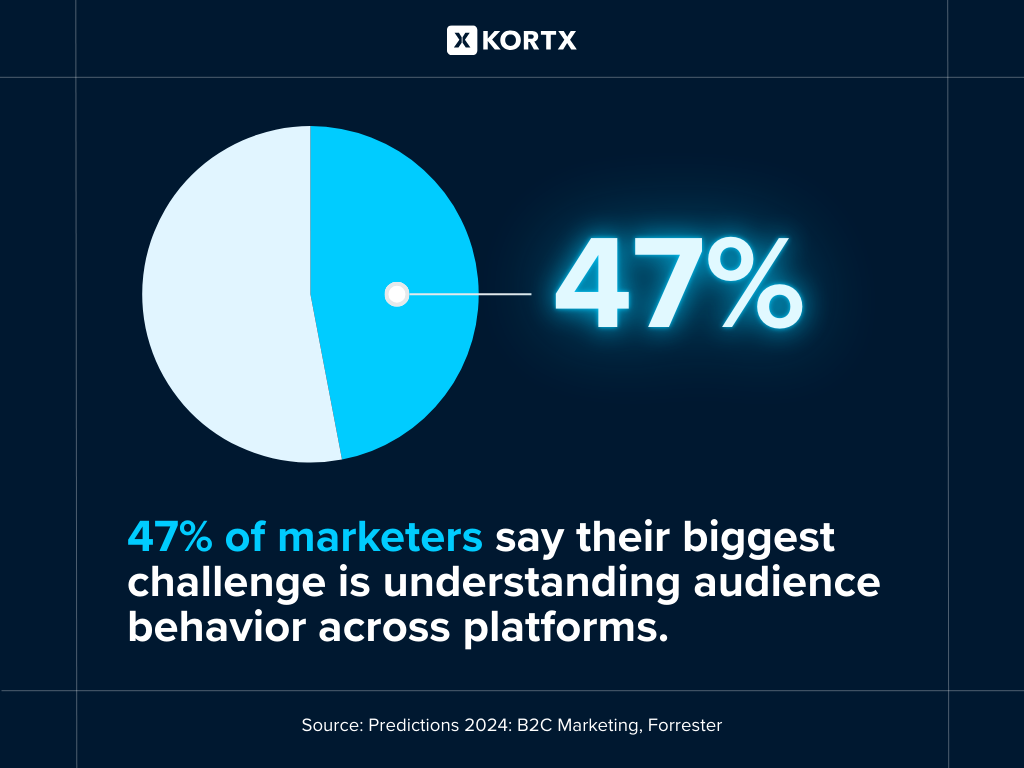
In 2024, 47% of marketers say their biggest challenge is understanding audience behavior across platforms.
2. Stay Agile and Ready to Adapt
Plans are a starting point – not a rulebook.
Let performance guide your decisions in real-time. Reallocate budgets, refine segments, and evolve creative elements.
Agile marketing adoption is growing by 25% annually, with 86% of marketers planning to shift some or all of their teams to agile methodologies, highlighting the effectiveness of responsive strategies.
3. Focus on Full-Funnel Impact, Not Vanity Metrics
Chasing clicks doesn’t grow your business.
Optimize for metrics that matter. This means conversions, customer lifetime value, and multi-touch attribution. Measuring what matters ensures every decision contributes to sustainable growth, not surface-level wins.
4. Target with Precision—Within the Limits of Your Data and Reach
More impressions ≠ more impact.
Use behavioral data, lifestyle traits, and purchase patterns to identify high-intent users. Precision marketing accelerates purchase timelines and cuts acquisition costs. But it only works when you keep optimizing.
Continue to iterate with each new campaign optimization.
Broad targeting wastes budget, unless scale demands it. In those cases, expand thoughtfully without losing precision. Do not sacrifice intent for volume.
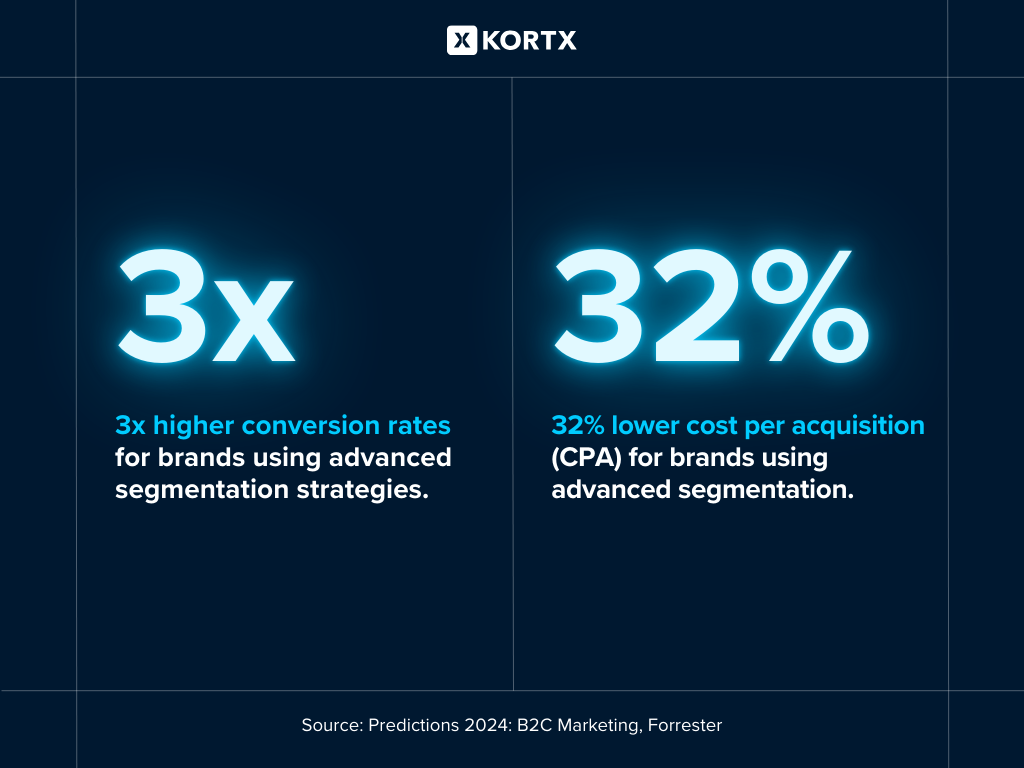
Brands using advanced segmentation strategies see up to 3X higher conversion rates and 32% lower CPA, according to Forrester’s 2024 predictions.
5. Let Data Shape Creative Strategy
Every interaction holds a clue, so use it.
The best creative blends data-driven strategy with space to experiment. Keep your creative briefs grounded in insights, but never boxed in.
That balance matters more than ever as platforms shift, privacy rules tighten, and customers expect relevance in every interaction.
Scalable Data-Driven Marketing Framework
Most marketers say they’re data-driven. But if your strategy relies on vanity metrics, siloed dashboards, or retroactive storytelling…
You’re not driving performance. You’re just spinning a narrative.
This is your no-BS framework for building smarter campaigns from the ground up. Every move becomes strategic. Every result, intentional.
Here’s what you’ll take away:
- How to define KPIs that tie directly to business outcomes
- Why disconnected data kills performance—and how to fix it
- What real audience segmentation looks like (hint: it’s more than basic demos)
- How to connect creative to behavior, not just brand guidelines
- A playbook for launching, optimizing, and reporting like a strategist—not a spreadsheet jockey
Let’s get into it.
1. Define Goals & Success Metrics
Every data-driven marketing effort begins with one question: What are we actually trying to achieve?
Without clear goals, even the best campaign setup can flounder. It’s easy to chase the wrong metrics, waste budget, or misrepresent results if you haven’t defined success from the start. It’s not enough to “optimize” if you don’t know what you’re optimizing for.
Start with a tangible business outcome.
Think: more online orders, increased appointment bookings, higher-value purchases, or a lift in qualified traffic. This keeps your strategy grounded in what drives growth, not what’s easy to measure.
Then, define your 1-2 primary KPIs that track that outcome.
ROAS, CPA, or average order value work well here. These are your North Stars.
Finally, layer in secondary metrics to support and diagnose.

“The best way to choose metrics? Start with the objective, then work backward.”
Al Morisset, VP, Products & Solutions, KORTX
What You’re Owning at This Stage
| Campaign Briefing | Your media brief should clearly state the business goal and how success will be measured. Example: “Objective: Increase online orders by 20% month-over-month with a target CPA under $25.” |
| Dashboard Setup | Build reporting dashboards before launch to ensure metrics are tracked from day one. Label clearly. Benchmark appropriately. Make it easy for non-analysts to follow. |
| Pre-Launch QA | Test your tracking setup. Example: Pull sample data from pixels or tags to confirm key events (purchases, form fills, calls) are firing correctly and tying back to your media sources. |
Connecting the Dots for Decision-Makers
“Our goal is to increase online orders by 20% month-over-month with a target CPA under $25. We’ll use ROAS and AOV as our primary KPIs.”
“We’ll monitor engagement metrics and change direction if things look off.”
- Start with the business objective: Make sure the client or exec knows what success looks like on day one.
- Define your North Star KPIs: Pick one key metric that tracks direct progress toward that goal.
- Clarify how secondary metrics play a role: Use VCR, viewability, CTR, bounce rate, or session length to diagnose—not define—performance.
- Build confidence with structure: Make it clear you’re not just running ads—you’re optimizing for a measurable business result.
2. Capture & Integrate Data
Data is only powerful when it’s connected.
Marketers today have more data than ever. First-Party signals, CRM platforms, offline transactions, and Third-Party insights all matter.
But if those sources live in silos, you’ll never get the complete picture of how your campaigns are performing or who your audience really is.
Start by identifying your key data sources.
That includes:
- First-Party Data: Website activity, form submissions, purchase behavior, app usage, CRM records
- Third-Party Data: Syndicated audience segments, behavioral data from partners
- Offline: In-store purchases, call center logs, loyalty programs, foot traffic data
Then, bring those sources into a single view.
Starting with free tools like Looker Studio or Google Analytics can help you integrate and visualize data from multiple platforms and sources. When you scale, paid platforms offer perks like real-time updates, API connectors, and custom reporting.
Tip: Don’t chase features. Choose tools that match your team’s evolving needs and your marketing goals.
Balancing the capabilities of advanced marketing tools with their associated costs is crucial. Assess your organization’s needs and resources to determine the most effective approach for integrating and managing your marketing data.

“Offline data becomes valuable when it can be onboarded, matched, and used for targeting. But you have to watch your match rates—poor onboarding can kill performance.”
Corey Rice, Director of Strategy, KORTX
What You’re Owning at This Stage
| Data Inventory Audit | Before launch, take stock. What data do you have? Where does it live? Is it structured, accurate, and usable? Examples: Website behavior (GA4), past purchase history (Shopify), customer service logs (Zendesk), and location data (foot traffic reports) |
| Platform Connections | Sync your key data platforms—analytics, CRM, and media channels—so they speak the same language. Example: Aligning your UTM tagging, conversion naming, and attribution windows. |
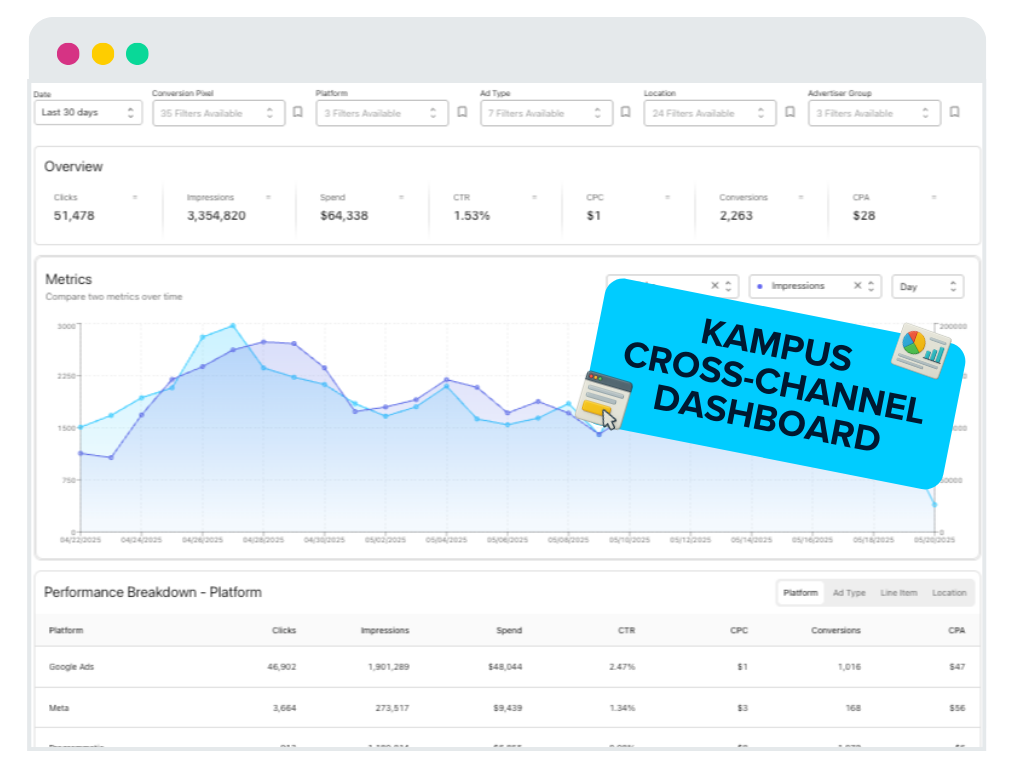
| Dashboard Setup | Create a central reporting dashboard before the campaign launches. Tools like Looker Studio, GA4, Adobe Analytics, or Kampus help you visualize what’s working across channels. Example: A multi-tab dashboard tracking spending, site engagement, conversions, and offline impact—built to be shared with internal teams or clients. |
Connecting the Dots for Decision-Makers
“We’ve connected media and CRM data to understand which campaigns drive conversions.”
“We pulled data from five platforms and dumped it into a dashboard.”
- Clarify, don’t clutter: Data should highlight what success looks like—not overwhelm or confuse.
- Show what integration unlocks: Faster optimizations, smarter audience segments, and real-story reporting.
- Reframe around outcomes: Emphasize the decisions the tools empower—not the tools themselves.
- Use visuals strategically: Share a simplified dashboard or flow chart. Highlight the insight, not the setup.
📊 By the Numbers: What Advanced Data-Driven Marketing Can Cost
Building a fully integrated, insight-driven marketing operation involves more than software fees.
Here’s a sample annual budget for a mid-sized team leveling up their data capabilities:
Total investment range: $156,000 – $237,500+ per year
3. Analyze & Segment
Segmentation starts with what you’ve got and gets smarter as you go.
You don’t need a massive data set to build smart audience segments. If you’ve defined your goals and connected your data (see above), you’re already in business. Site behavior, engagement trends, and basic conversion paths are more than enough to start drawing meaningful distinctions.
The real value of a data-informed approach? It compounds.
As campaigns run and performance data rolls in, your segmentation can evolve. The more you market, the more data you collect. And the more data you collect, the better your targeting gets.
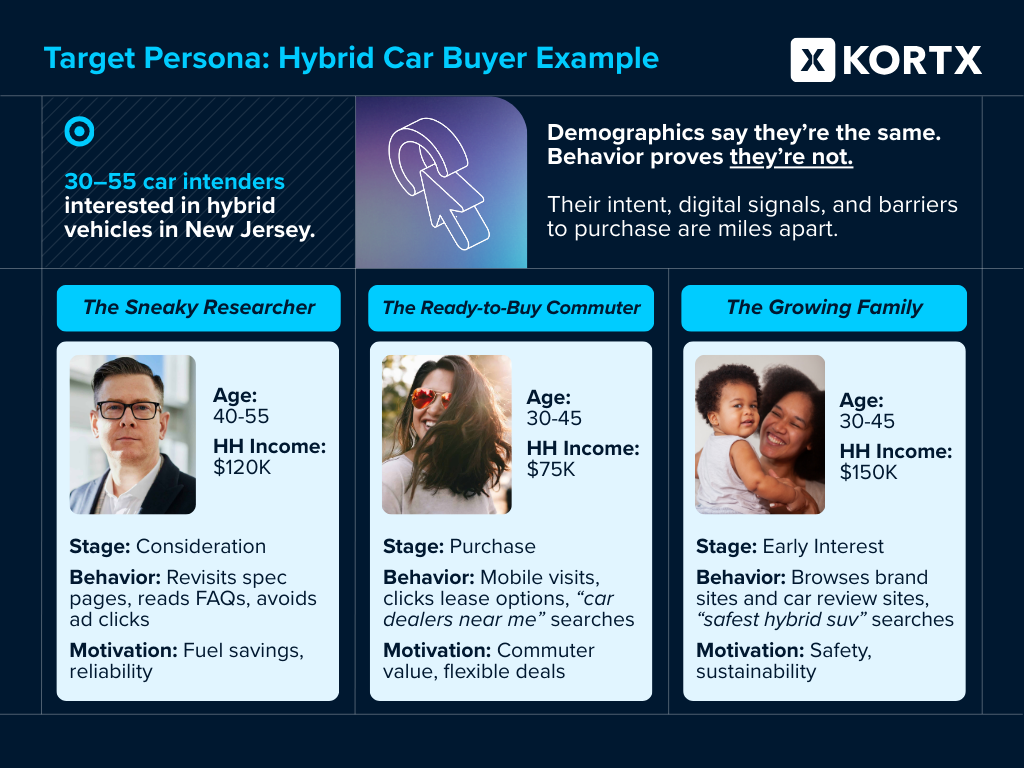
Start by looking beyond demographics.
Age and location are table stakes. If you want to move the needle, focus on:
- Behavioral signals: Pages visited, time spent, visit frequency
- Purchase activity: What they bought, how often, and in what order
- Engagement trends: Email clicks, ad interactions, loyalty behaviors
Then, segment your audience by intent and behavior.
Not all traffic is equal. One user might visit your pricing page three times a week, while another skimmed a blog post and bounced. Who’s showing buying signals? Who’s not? Answer that, and you can tailor messaging, bids, and budgets with real precision.
“Lifestyle traits are a strong proxy for going beyond broad demos. Look at how they behave, not who they are.”
Corey Rice, Director of Strategy, KORTX
What You’re Owning at This Stage
| Audience Deep Dive |
Start with the signals you already have. Pull reports from GA4, your CRM, or media platforms to find repeat visitors, high-intent behaviors, and/or key dropoff points in the conversion process. Example: Users who visited a specific product category 3+ times but didn’t convert. |
| Behavioral Segments |
Use tools like Meta Custom Audiences, DSP audience tools, or GA4’s audience builder to segment by behavior and funnel stage. Example: Create separate segments for users who viewed your “Pricing” page vs. people who only read top-of-funnel content. |
| Real-World Personas |
Watch how people interact with your site and/or ads. When users return to the same sections, they’re showing you what matters. Group them by patterns of interest or intent. These behavior-based clusters become your working personas—real, not hypothetical. Refine them as more data comes in. Example: A user who keeps visiting the “Home Services” section behaves very differently from someone poking around the About page or Careers. |
Connecting the Dots for Decision-Makers
“We’re targeting users who visited product pages multiple times but haven’t converted—because they are showing real intent.”
“We’re going after people aged 25–44 interested in fitness.”
- Elevate the conversation: Shift from tactical targeting to strategic business goals.
- Explain segmentation logic: Describe how each audience is built using real behavior or platform signals—not just demographics.
- Tie segments to user intent: Map audiences to their mindset, funnel stage, or likelihood to convert.
- Visualize the strategy: Use simple audience grids, funnels, or flows to connect data to outcomes.
- Show performance impact: Even directional wins help—lower CPAs, better ROAS, higher engagement.
4. Plan Creative & Messaging
Creative should be driven by data. Not limited by it.
Audience insights should shape how you speak, what you show, and where you show up. But that doesn’t mean every asset needs to be hyper-targeted or painfully literal. Balancing data with experimentation ensures your marketing remains fresh. The best creative uses data as a springboard, not a set of constraints.
Data gives you direction. It doesn’t replace creative instincts—it sharpens them.

“Use data to inspire, not to creep. Don’t say, ‘We saw you looking at this.’ Say, ‘People like you are loving this.’”
Eric Simone, Lead Designer, KORTX
What You’re Owning at This Stage
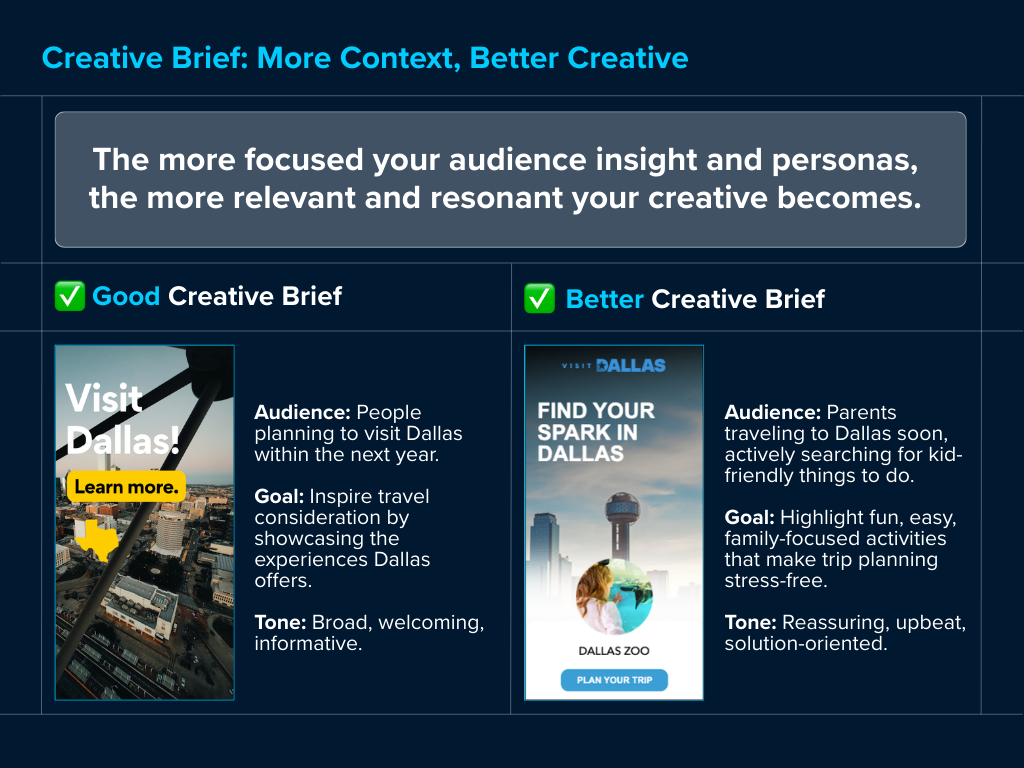
| Creative Briefs Built Around Behavior |
Don’t write for personas. Write for actions. Example: Users who keep visiting the “Landscaping Services” page? Hit them with before-and-after visuals, seasonal tips, and a service-specific CTA. They’ve moved past awareness—they’re looking for a reason to say yes. |
| Test Variations That Matter |
Don’t waste your A/B test on color swaps. Focus on creative variables that shift perception or intent. Example: For high-intent audiences, test “Book Now” vs. “See What’s Included.” One removes friction. The other builds trust. Both give you insight. |
| Adapt Creative by Channel and Format |
Let audience behavior guide delivery without repeating the same message everywhere. Example: A mobile-first audience might respond better to thumb-stopping short-form videos on social media, while desktop users may prefer detailed visuals or comparison-driven landing pages. |
Connecting the Dots for Decision-Makers
“We built this creative for users who keep visiting our pricing page but haven’t converted. It focuses on value messaging and social proof to move them from interest to action.”
“We made a few different versions and picked the one we liked best.”
- Tie creative to strategy—not taste: Show how messaging, visuals, and format were shaped by audience behavior or funnel stage.
- Clarify what’s being tested: Be explicit about creative variables in play and what you aim to learn.
- Let performance guide evolution: Creative gets better with data. Show how early results shape the next version.
How to Present Data to Your Creative Team (So It Actually Sparks Ideas)
Creative teams don’t need a dashboard. They need a clear picture of who they’re talking to and why it matters. Instead of dropping raw numbers into a brief, translate your insights into people, motivations, and context.
✅ Do say:
👪 “These users are typically parents browsing in the evening—most have visited the services page but haven’t booked. They value reliability and want to feel confident before making a decision.”
🛫 “We’re targeting frequent business travelers. They care about convenience and trust peer reviews. They’re most often on mobile devices.”
🌱 “This audience skews eco-conscious and spends time on our sustainability page. Messaging should reflect values and impact.”
🚫 Don’t say:
📉 “CTR dropped 10%”
📊 “Users are exiting on the pricing page.”
🧑💻 “Target audience: Adults 25–44”
5. Strategize & Launch Campaigns
A strong campaign strategy connects every dot—audience, creative, channels, and goals.
Now that you’ve set KPIs, integrated your data, built your segments, and developed behavior-driven creative, it’s time to launch.
You’re not here to set it and forget it.
Plan for flexibility before you spend a dollar.
Because no matter how much research you’ve done, strategy is still a hypothesis. Real-world data will either validate it or push you to change course. Be ready.
Do you have the infrastructure in place to pivot?
Before you launch, ask yourself (and your team):
- Do we have time and staff dedicated to watching early performance?
- Do we have clear decision points for when to optimize, pause, or shift?
- Are tools like SplitAssist in place to prioritize top-performing audiences automatically?
- If you’re working with a media partner, how will they monitor and adjust in real-time?
- What reporting cadence is in place, and who owns it?

“Pre-campaign research is a hypothesis, not a rule. Campaigns evolve as real-world data comes in.”
Bryan Presti, Head of Programmatic Trading, KORTX
Build your media plan around real behavior—not assumptions.
Let your segmentation and audience insights guide where, how, and to who you show up.
- If your high-intent segment is mobile-first and values speed, lean into social video and mobile-friendly landing pages.
- If your users spend time comparing services or features, focus on content-rich placements like native articles or on-site content hubs.
Don’t spread your budget across every platform “just in case.” Depth usually wins over breadth, especially at launch.
What You’re Owning at This Stage
| Media Planning Based on Behavior |
Build your media plan around how your audience actually behaves. Avoid assumptions. Example: A B2B segment that regularly visits your resources or blog may convert better through LinkedIn retargeting or sponsored lead-gen content. |
| Pair Creative to Audience + Mindset |
Make sure your message matches both mindset and moment. Example: A user who’s viewed your pricing page three times doesn’t need awareness. They need proof and urgency. Hit them with value-first messaging and strong CTAs in high-impact placements like video pre-roll or carousels. |
| Launch With Intention |
Start lean but structured. Don’t throw everything out at once. Example: Launch with 2–3 audience segments and 2 creative variations per segment across your top 1–2 channels. Use performance signals to scale from there. |
Connecting the Dots for Decision-Makers
“We’re launching with three high-intent segments across paid social and display, paired with value-based creative. We’ve built in checkpoints at day 7 and day 14 to optimize based on early signals.”
“We’re launching everywhere with a few versions to see what happens.”
- Execution starts the moment the budget is approved: Treat launch like part of the strategy—not just the start date.
- Lay out the plan with structure and flexibility: What segments go live? What creative? Which channels?
- Define how early performance guides next steps: When will you review? What signals will prompt an adjustment?
- Clarify your reporting cadence: Set expectations: weekly check-ins, mid-flight recaps, and ownership of deliverables.

6. Optimize in Real Time
Strategy is only as strong as your ability to adjust it.
Once your campaign is live, real-time data becomes your most valuable asset and your biggest reality check. What looked solid in planning might underperform in the wild. What you thought was a top audience might not convert. That’s not failure. That’s feedback.
The key? Know what to look for, how soon to act, and when to hold your ground.
Know what matters early and what’s just noise.
Not all performance signals are helpful in week one. Focus on metrics that show directional traction:
- Are you getting scale and impressions in your top audiences?
- Are engagement rates within the benchmark range?
- Are certain creative variants clearly outperforming others?
Don’t overreact to a bad Tuesday. But move quickly if you see consistently underperforming placements, wasted budget, or non-converting audience segments.
“We’re not tied to the original strategy. If it’s not working, we move. Fast.”
Bryan Presti, Head of Programmatic Trading, KORTX
Have a clear process for what to adjust—and when.
Campaigns don’t optimize themselves (unless you’re running something like SplitAssist, which automatically reprioritizes based on performance signals).
Whether manual or automated, your team needs a process:
- ☑ Check pacing and spend daily
- ☑ Review audience + creative combos 2–3x/week
- ☑ Evaluate performance trends every 7–10 days
- ☑ Flag anything under benchmark for a deeper review
What You’re Owning at This Stage
| Kill Underperforming Placements Quickly |
Don’t let bad traffic drain the budget. If a site or app tanks viewability or conversions, cut it. Example: We’ve banned placements with low-quality traffic within the first 48 hours after seeing sub-50% viewability and 0 conversions. |
| Reallocate Budget Based on Signals |
Shift dollars to the channels, audiences, and creatives gaining traction. Example: If mid-funnel retargeting is driving 3x the ROAS of a broad prospecting audience, scale it. Pause any waste and dial back underperformers. |
| Keep Campaigns Moving, Not Just Live |
Optimization is not maintenance. It’s momentum. Example: If you see strong mobile conversions but weak desktop activity, double down on mobile formats, refine desktop creative, or pause it entirely. |
Connecting the Dots for Decision-Makers
“We’ve paused underperforming placements and reallocated budget to the segments driving the highest engagement. Early data shows strong results from mobile-first audiences, and we’re adjusting creative accordingly.”
“We’re keeping an eye on things and will make changes with our next campaign.”
-
- Your value as a marketer should be crystal clear: Don’t just say what changed—explain why and what’s next.
- Prove that the strategy is working or evolving: You don’t need perfection, just progression—and proof you’re paying attention.
- Own the feedback loop: Show how insights are shaping creative, shifting spend, and improving outcomes.
🚨 Real-Time Moves: Bryan Presti’s Pro Tips for Smarter Optimization
Straight from the source. Bryan Presti, Head of Programmatic Trading at KORTX, shares his real-world advice for staying sharp once campaigns go live.
1. Don’t wait for perfect data.
“You’ll never have all the answers in week one. Directional signals are enough to make smart calls early—especially when something’s clearly not working.”
2. Don’t waste impressions on the wrong audience.
“Broad doesn’t mean effective. If a segment isn’t showing signs of life, shift that spend. Quickly.”
3. Watch creative and audience together.
“It’s not which ad works—it’s which ad works for whom. Always evaluate combinations, not individual elements.”
4. Budget = behavior.
“If you want to know what’s working, look at where the budget flows after launch. That tells you where your media is performing, and where it’s being rejected.”
5. Move fast—but with purpose.
“Knee-jerk optimizations help no one. Build in checkpoints. Move when the data has something to say.”
7. Report & Translate Insights into Business Language
Results should be a trigger for action, not a trophy.
Campaign reporting isn’t a recap. It’s a translation. In 2024, 58% of CMOs said clear marketing reporting directly influenced budget approvals and strategic pivots.
Your job is to connect performance metrics to business results in a way that’s clear, contextual, and immediately usable.
You’re here to find the truth and turn it into momentum. Even when the results aren’t “up and to the right,” your insights should move the business forward.
Start by focusing on outcomes, not outputs.
Skip the wall of metrics. Lead with what matters:
- Did the campaign drive qualified leads or purchases?
- Did it generate higher-value conversions or more efficient spend?
- Did it improve performance among priority audiences or key funnel stages?
Then, back it up with supporting data (audience performance, creative insights, channel breakdowns), always tying it back to the original campaign goals.

“Start with the story, not the numbers. Business leaders don’t want a spreadsheet—they want a reason to act.”
Jess Ostrom, VP of Client Services, KORTX
What You’re Owning at This Stage
| Tailor Your Reports by Audience |
Execs don’t need pacing charts. Your media team does. Example: Build a dashboard with tabs for strategy, performance, and optimization notes. Give leadership a snapshot, and give media specialists the details. |
| Translate Metrics into Movement |
Don’t simply report a 14% increase in engagement. Explain what led to it. Example: “Landing page engagement jumped 14% after updating the CTA, which drove a 22% lift in form submissions.” |
| Add Strategic Commentary, Not Charts |
Put your POV next to the data. What’s working? What needs to shift? What’s next? Example: “Retargeting drove strong conversion rates, but performance dropped after day 10—recommend refreshing creative every 7–10 days moving forward.” |
Connecting the Dots for Decision-Makers
“This campaign drove a 28% increase in online bookings from repeat visitors. Most conversions came from the retargeting audience, which we plan to expand next month using lookalike segments.”
“CTR was 1.2%, CPA dropped to $36, and ROAS came in at 2.9x.”
- Lead with impact, not acronyms: Tell them what moved the business—then show how it happened.
- Highlight wins and what you learned: You’re not reporting to impress. You’re reporting to improve.
- Turn your report into the next brief: Use performance insights to shape your next campaign.
Reporting isn’t the end of the campaign. It’s the beginning of the next one.
🧯 When Performance Misses: How to Report It Without Losing the Room
Not every campaign hits the mark. That doesn’t mean you failed. It means you’ve got insight. Here’s how to share underperformance to build trust, show control, and keep momentum.
1. Lead with the truth, not the spin.
Avoid sugarcoating. Be direct about what didn’t meet expectations and say it before someone does.
“We didn’t hit our conversion target this round. Volume was strong, but quality didn’t follow through—which tells us our targeting needs refinement.”
2. Anchor everything to the original goal.
Remind stakeholders what success was defined as and measure against that. It shows discipline and clarity.
“Our goal was to drive demo requests at $40 CPL. We came in closer to $60, which tells us this channel isn’t as efficient for lower-funnel activity as projected.”
3. Explain the why, not the what.
If results came in low, break down the likely drivers: Was it audience quality? Platform underdelivery? Messaging mismatch?
“Engagement dropped after week one, and we saw fatigue in our creative. We also suspect the landing page didn’t align with ad messaging—causing the falloff.”
4. Share what you’re doing about it.
The most important slide: “Here’s what we should do next.” That’s where accountability becomes action.
“We paused two underperforming placements, reallocated to a high-ROAS segment, and are launching refreshed creative this week.”
5. Turn the miss into the next move.
Reframe misses as inputs for iteration.
“This offer didn’t resonate with high-intent users. So next, we’ll test trust-based messaging with stronger social proof.”
8. Transform Data Into Business Intelligence
Business intelligence is the final boss of data-driven marketing.
Campaign data can fuel smarter decisions across an entire organization. When insights influence operations, sales workflows, messaging, and product strategy, marketing becomes a growth catalyst.
Your role is to surface the signals that unlock strategic advantage. When teams have the right information at the right time, they move faster, stay aligned, and make more confident choices. Insight becomes momentum. Decisions become easier.
The value of your work doesn’t stop at the campaign, it shapes what happens next.

“When a company is using data the right way, their decisions start to feel obvious—not because they’re guessing, but because the insights are clear.”
Chris Rowell, CRO & Co-Founder, KORTX
What You’re Owning at This Stage
| Insights Beyond Marketing |
You’re responsible for surfacing the data that informs business decisions like pricing, sales strategy, and customer experience. Example: Own the delivery of those signals. Frame them clearly, add context, and make them actionable. |
| Clarity That Sparks Action |
Focus on the insight that unlocks movement. One meaningful takeaway with real context does more than pages of metrics. |
| Embedded Data Habits |
Establish post-campaign recaps, insight-sharing rhythms, and stakeholder check-ins. Example: When these habits are baked into the process, your team becomes a go-to source of strategic intel. |
Connecting the Dots for Decision-Makers
“CRM and media data showed move-ins increased when tour bookings were followed up within 24 hours. Recommend prioritizing same-day outreach across all locations.”
“We noticed more conversions when follow-ups happened faster.”
- Don’t just report what happened: Spell out what it means. Your recommendations should include next steps for marketing and, when appropriate, clear business suggestions.
- Make the takeaway obvious: Back it with context and point to what should happen next.
- Do it consistently: When you connect the dots often, marketing becomes more than a performance engine—it becomes a source of direction for the whole business.
Make your insights too useful to ignore.
Avoid the “Data-Driven Dummy” Trap
Too much data can cloud judgment and stall good decisions. Smart marketers use data to support insight, not replace it. When you rely on metrics alone, it’s easy to lose sight of what actually connects with real people.
Here’s how to keep your marketing sharp and human:
Use algorithms to guide, not decide.
Platform suggestions aren’t always the right next move. Let the data inform your direction, but trust your experience and audience.
Gut check every insight. Would this message land with a real person or look good on a dashboard?
Make space for the customer’s voice.
Dashboards tell you what people do. Customers tell you why. To close the gap, introduce surveys, feedback loops, reviews, and post-purchase touch points.
Bonus: This kind of qualitative input often reveals blind spots you won’t find in the data.
Personalize with care, not creepiness.
Personalization is powerful, but only when it feels relevant and not intrusive. Focus on behavior-driven triggers (what someone did), not assumptions about identity (who you think they are).
Build relationships, not click paths.
The data can tell you what someone did. But real marketing asks: Did they feel something? Did it earn trust? Campaigns that respect the customer consistently outperform those that chase conversions.
💥 Data Challenges & How to Solve Them
Even the smartest marketers hit roadblocks. Disconnected systems. Messy CRM data. Campaigns built on the wrong metrics.
These are the most common challenges we see—and what to do about them.
If two or more of these are slowing you down, it might be time to bring in a partner.
KORTX helps brands and agencies connect strategy to execution.
Data-Driven Strategy in Action [3 Case Studies]
These examples show how KORTX uses data with intent to drive targeting, creative, and strategic decisions.
How a Data Reset Delivered 6K of High-Intent College Applicants
The college had data, but it wasn’t actionable. Campaigns targeted broad audiences, tracked surface-level metrics, and struggled to tie spending to actual enrollment.
High-intent behaviors drove meaningful conversions. We built intent-based segments for adult learners, first-time students, and dual enrollment prospects. Additionally, we excluded current students to reduce waste. We shifted from CTRs to real signals like form fills and “Apply Now” clicks to get a clearer view of performance.
Over 6,000 applications and a $22 average CPA across programmatic. Paid search delivered new student leads at under $9 each, tied to a measurable lift in actual enrollments.
Reengaging the Right Donors Drove a 17% Lift in Donations
The American Cancer Society had strong brand awareness, but donor fatigue was real. Their audiences weren’t segmented deeply enough to reengage lapsed givers.
Lapsed donors responded to targeted reengagement. We segmented by recency, frequency, and donation type using our Axon Framework, then layered in behavioral signals to find high-propensity donors. Exclusion audiences helped us avoid waste and respect recent givers.
ACS experienced a 17% year-over-year lift in donation revenue. This increase was due to engagement from reactivated donors and stronger efficiency across channels.
Using Smart Geo Signals to Turn Reach Into 121K+ Sweepstakes Entries
Pepsi had strong creative and a high-profile offer, but reach alone wasn’t converting. The real challenge was finding pockets of intent within crowded media markets and activating hyper-local audiences to drive participation, not views.
Localized intent signals identified high-converting audiences. We used Axon audience framework to map high-intent geos around retailers and Yankees fan zones, then layered in mobile device data to prioritize audiences most likely to engage. We filtered out low-quality placements early and optimized based on conversion signals.
The campaign delivered over 3.5 million qualified impressions and drove 121K+ sweepstakes entries, proving that geo-specific intent beats generic reach every time.
Data Doesn’t Win Campaigns. Decisions Do.
Most teams don’t need more data. They need alignment on what matters, discipline in how they measure it, and a clear path from insight to action.
Strategy sharpens when you focus on what actually moves the needle.
When strategy, creative, and performance align, you don’t move faster. You move smarter.

ABOUT THE AUTHOR
Kaylee Pope is a Senior Content Strategist at KORTX. This post was written and edited by Kaylee, with insights from nine KORTX experts across media, strategy, analytics, and data intelligence. Their contributions shaped every section of this guide—from planning to performance to business impact.
Contributors include Corey Rice (Director of Strategy), Bryan Presti (Head of Programmatic Trading), Eric Simone (Lead Designer), Eric Lee (Co-Founder & COO), Jessica Ostrom (VP of Client Services), Maria Wittbold (Senior Account Manager and Team Lead), Al Morrisset (VP of Product & Solutions), Josh Pettovello (Lead Marketing Analyst), and Chris Rowell (Co-Founder & CRO).