
Analyzing marketing data helps companies make smarter decisions.
Your data analysis process reveals who your users are, what they expect from you, and how successful your marketing campaigns are at converting them. It also provides evidence of your successes and indicates when your strategy needs adjustment.
Review fundamental marketing data analysis techniques and demonstrate how to use these insights for strategic decision-making below.
6 Marketing Data Analysis Techniques
These essential data analysis techniques will help refine your approach. A successful process helps you evaluate your marketing tactics and improve them month to month.
1. Target Audience Analysis
Audience analysis involves reviewing your audience’s demographic, market research, and behavioral data to understand who your customers are and their purchase motivations.
From here, you can create detailed personas, segment and tailor advertising messaging to specific groups, and develop campaigns that meet your target audience’s unique needs and preferences.
Example: Audience analysis may reveal that part of your target audience is single, professional women aged 45-60 primarily interested in luxury who use social media during evening hours while watching a Netflix show on CTV (Connected TV). You can target them with paid social and CTV ads, incorporating interactive carousel ads with creatives that highlight luxury products.
Tools You Can Use:
- Google Analytics 4 (GA4): GA 4 identifies your audience, their interests, and how they interact with your website.
- Neustar: Neustar provides extensive data and analytics to define and understand your target audience.
- Dstillery: Dstillery leverages First-Party data insights to offer precise audience segmentation and targeting.
2. Conversion Analysis
Conversion analysis identifies which campaign elements drive users to convert or complete desired actions like purchases or sign-ups. Marketers gain valuable insights by tracking key performance indicators (KPIs) such as click-through rates (CTRs) and conversion rates across various ads, platforms, and audience segments.
Tracking pixels—small code snippets on websites or emails—monitor user interactions, such as ad clicks or purchases and greatly enhance conversion analysis. These pixels help map user journeys through the conversion funnel, revealing the effectiveness of different creatives and targeting strategies.
Tools You Can Use:
- Kampus by KORTX: Kampus provides detailed conversion analysis by pulling in cross-platform reports to analyze conversion volumes from each marketing tactic.
- CM360: CM360 offers comprehensive conversion tracking and reporting capabilities to help you understand the effectiveness of your marketing efforts.
What are actionable metrics, and how do they improve advertising campaigns, especially during conversion analysis?
“Actionable metrics allow marketers insight into true business outcomes rather than just how many times an ad is viewed or clicked. These metrics can include store visitation, conversion rate, ROAS, etc. With technological advancements today, we can track a customer’s actions after they see an ad – whether they fill out a form, download a document, or buy something. This helps marketing teams make more informed decisions, ensuring that every dollar spent on advertising works harder to achieve real results.”

📚 More from Jess: Successful Programmatic Advertising Measurement: Moving Beyond Vanity Metrics
Learn why optimizing for traditional marketing metrics like CTR can limit your ability to reach your target audience.
3. Competitor Analysis
Competitor analysis involves studying your main competitors to understand their marketing and advertising strategies.
Tools like AdBeat, Pathmatics, and PowerAdSpy reveal how competitors allocate budgets and target audiences, and craft ads. With these insights, you can spot opportunities, avoid mistakes, and sharpen your strategies.
Tools You Can Use:
- SimilarWeb: SimilarWeb provides insights into your competitors’ website traffic, including sources, audience demographics, and key metrics.
- AdBeat: AdBeat offers a detailed analysis of your competitors’ online advertising strategies, revealing where they advertise and their ad creatives.
4. Market Research Analysis
Market research analysis delves into understanding broader market conditions, consumer preferences, and emerging trends.
By synthesizing data from past surveys, social media listening, and industry reports, advertisers can identify new opportunities and predict shifts in consumer behavior.
Tools You Can Use:
- eMarketer: eMarketer provides comprehensive data and insights on digital marketing, media, and commerce trends.
- Statista: Statista offers extensive statistics and reports on various industries and market trends globally.
5. Ad Creative Analysis
Ad creative analysis meticulously evaluates how advertising elements like colors, fonts, imagery, and copy perform across various demographics and platforms. The first step involves gathering comprehensive ad data, which can be complex if spread across multiple platforms or vendors.
Key Sources for Ad Performance Data
- Ad Platform Dashboards: Measure performance metrics such as reach, engagement, and conversions.
Examples: Google Ads, Meta Business Suite - Analytics Platforms: Integrate with ad accounts to track demographics and analyze funnels.
Examples: Kampus, Google Analytics - Email Marketing Platforms: Provide insights into open rates, CTR, and conversions for email campaigns.
Examples: Mailchimp, Klaviyo - eCommerce Platforms: Track product views, conversions, and revenue attributed to ads.
Examples: Shopify, BigCommerce - Third-Party Ad Tools: Aggregate data from multiple ad platforms for comprehensive reporting.
Examples: Google Data Studio, Tableau
Using the above sources, you can track key performance indicators such as click rates and use advanced tools like heatmaps and engagement metrics to provide direct feedback on which aspects of an ad are most engaging to viewers.
6. Marketing/Media Mix Modeling Analysis
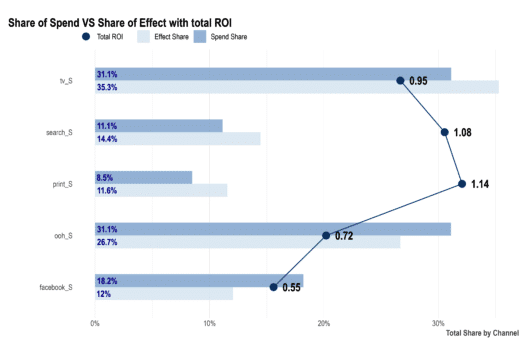
Marketing Mix Modeling (MMM), also called Media Mix Modeling, evaluates how elements like media spend, promotions, pricing, and distribution influence outcomes by using statistical analysis of historical data
MMM allows businesses to identify the best combinations of advertising channels and tactics, adapt strategies to market shifts, and understand product demand elasticity.
Tools You Can Use:
- Cassandra: Cassandra is an MMM tool that provides insights into the effectiveness of various marketing channels and their impact on sales.
- Meta’s Robyn: Meta’s Robyn is an open-source market mix modeling tool designed to optimize marketing budget allocation across different channels.
📚 Related article: Media Mix Modeling: What It Is & How It Maximizes ROI
Explore what MMM is, how it works, and why it should be a vital part of your advertising campaign optimization.
How to Analyze Marketing Data
Market research analysis empowers businesses to precisely measure their marketing efforts, enhancing ROI and customer engagement by identifying strategies that yield successful results like better campaign performance and higher ROI.
Explore the essential steps to optimize campaigns and drive better marketing decisions.
Note: The steps for making campaign optimizations vary depending on the KPI and tactic.
Step 1: Review Goals & Marketing Mix Strategy
Begin your marketing data analysis by revisiting the initial goals or Key Performance Indicators (KPIs) you set at the campaign’s start.
Log into your reporting platform, such as Kampus, to pull up performance data.
Review the desired metrics you were aiming for, such as conversions, ROAS, or clicks.
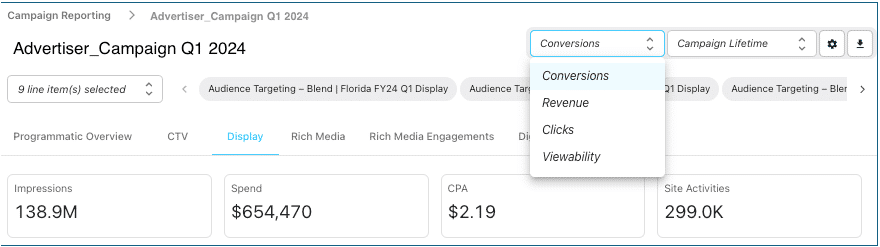
In Kampus, you can select the KPI you set at the start of your campaign to review your goals and their success.
1. Analyze Your Marketing Mix
Examine your rationale behind the campaign strategies. Why were certain platforms chosen? What was the thinking behind these selections? Connect the dots between your campaign’s goals and the strategies you employed to achieve them.
Step 2: Gather Industry & Historical Benchmarks
Although industry benchmarks are a good starting point, your best benchmarks come from comparing your data against your own historical data, as industry benchmarks don’t account for unique factors like geo, audience composition, budgets, and unique website experience.
Historical data aids in identifying trends and assessing data maturity, reflecting the accumulated depth and quality of data over time. Data maturity allows for more accurate predictions and achieves 2.5x better business outcomes across the board for revenues and profits.
For a more customized analysis, resources like KORTX Intelligence can offer insights tailored to your specific context. These reports provide deep insights and are particularly useful for comparative analysis, showing how your campaign measures against previous efforts or industry standards.
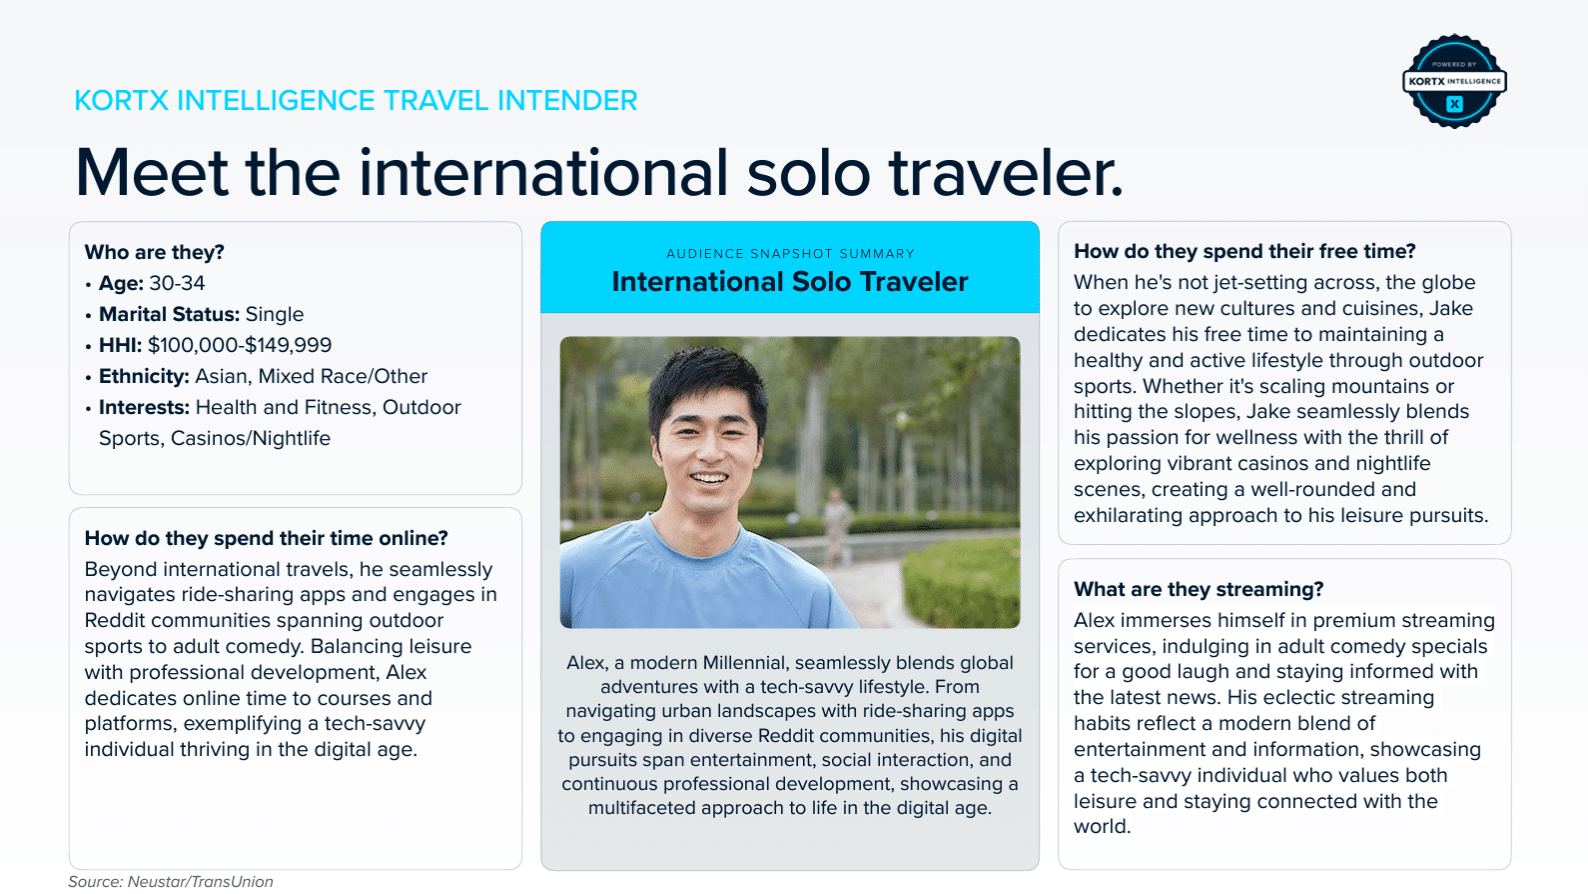
A sample page of a KORTX Intelligence report. KORTX Intelligence analyzes your industry, audience, brand, and competition to offer data-rich insights.
Why is historical data so important when analyzing marketing data?
“Historical data is vital as it helps reveal performance patterns over time. By looking at past results, we can spot trends, anticipate what might happen next, and make smarter choices. This knowledge allows businesses to improve their strategies and react better to changes in the market.”

Step 3: Explore Your Data in Depth
After establishing benchmarks, review your campaign’s performance details. Start by aligning your collected data with the initial goals and benchmarks you identified.
1. Analyze Performance Trends
Examine how the campaign performance is trending over time. Use trend charts, spreadsheets, and other analytical tools to track progress. Are the results improving, declining, or remaining constant? Look for patterns that could indicate your strategies’ effectiveness over the campaign’s duration.
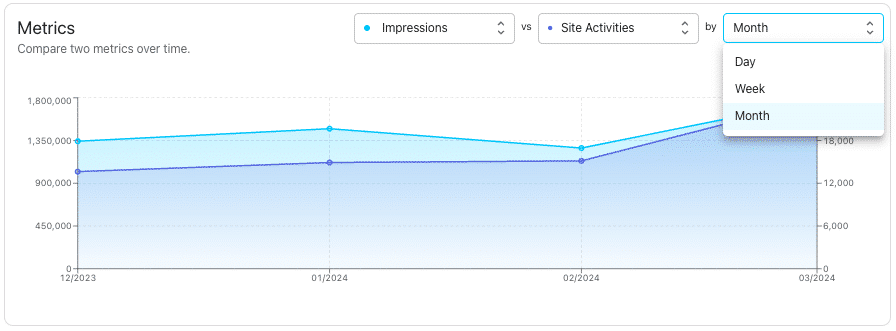
In Kampus, you can compare two metrics together over a specified time. This example compares impressions to site activities.
2. Identify Spikes and Dips
If there are noticeable spikes or dips in the campaign data, investigate what may have caused these fluctuations. Consider external factors such as market changes, competitor activities, or changes in consumer behavior that might influence performance.
Consider factors such as market changes, website tagging or loading issues, competitor activities, or changes in consumer behavior that might influence performance.
3. Evaluate Channel Performance
For cross-channel campaigns, analyze how each channel contributed to the overall performance as well as how these channels are working together to drive users through your unique consumer journey.
Determine which channels were more effective and why. Higher-funnel tactics like Connected TV (CTV) may not show much attribution but still play a vital role in campaign performance. Look for cross-channel trends related to tactic activation or deactivation, such as an increase in paid search clicks after activating CTV.
4. Review Audience Targeting and Creative Elements
Assess the audience targeting tactics used and identify which ones were more successful. Review the creative analysis to understand which elements (e.g., ad design, messaging) resonated with the audience and which did not.

Step 4: Identify Optimization Opportunities
Revisit the performance trends you identified in the previous step. Assess why certain trends occurred by linking them to specific campaign actions or external factors.
Are certain creatives bringing the best performance? Ensure they stay in-market. Seeing a drop off in paid search performance after pausing CTV? Adjust your strategy to ensure you have a presence in both tactics. Are certain audiences bringing in stronger performance? Prioritize delivery to those audiences.
Understanding the ‘why’ behind the data is key to making informed decisions.
1. Learn from Current Data
Use the insights gained from your analysis to determine what worked well and what didn’t. Identify successful elements of the campaign that can be amplified or optimized further. Similarly, pinpoint areas that underperform and require adjustment or complete overhaul.
2. Testing New Strategies
Based on the analysis, develop hypotheses for how different aspects of the campaign could be improved. Implement A/B testing or multivariate testing to experiment with these new ideas. This could involve testing variations of ad creatives, trying new audience segments, adjusting the marketing mix, or experimenting with different channels.
3. Apply Learnings to Future Campaigns
Document the results and learnings from your tests. Apply these insights to enhance current campaign strategies and guide the development of future campaigns. This ongoing learning cycle is crucial for continuous improvement and staying competitive.
Step 5: Consider Marketing Mix Modeling (MMM)
Marketing/Media Mix Modeling (MMM) can significantly enhance your understanding of what influences your campaign’s success.
One significant advantage of using MMM is that it automatically covers many analytical bases. By integrating various data points and providing a comprehensive view of performance across all marketing channels, MMM reduces the need for manual analysis and simplifies the decision-making process.
MMM not only aids in understanding past performance but also supports future planning. By modeling different scenarios, you can forecast the potential outcomes of various strategies, helping you make more informed decisions about where to allocate resources.
MMM tools reveal only what is statistically significant and present only the best models. We’ll use the data from the output result to determine the best-fit model for your business.
Why is MMM important for analyzing marketing data?
“As the digital marketing environment faces a paradigm shift with the phasing out of Third-Party cookies, the imminent cookie-less world has expedited the need for robust, privacy-compliant methodologies to measure and understand the effectiveness of marketing efforts. This is where Media Mix Modeling (MMM) emerges not just as a relevant tool, but an essential one.”

Data-Informed Marketing is Successful Marketing
After setting up a data analysis process that effectively gauges your progress and deepens your understanding of your audience, the key is to apply it consistently. Regularly measuring and analyzing your data will reveal increasingly clear patterns. Through consistent review and adaptation, you’ll refine your ability to engage your users and achieve your marketing objectives.
Transform Your Data Into Actionable Intelligence
Discover how our advanced tools and expert insights can help you unlock the full potential of your marketing strategies and drive superior results.
About the Author
Jeff Israel is the Director of Analytics at KORTX.