Experiences refined for people
Experiences refined for people
Without an end-of-year sales and marketing report, businesses may miss out on critical insights needed for informed decision-making and strategic planning for the future.
An end-of-year sales and marketing report takes important data from multiple marketing channels and presents it in one place. It’s a way to measure what channels are performing well and which need improvement.
This article walks you through the basics of an end-of-year marketing report, outlining what it is, how to compile it, and offers tips for creating your own end-of-year report.
An end-of-year sales and marketing report is a comprehensive document that businesses compile at year’s end to evaluate their marketing performance and success over the past twelve months.
It’ll reveal if you’re meeting your marketing goals, including which campaigns worked and which missed the mark.
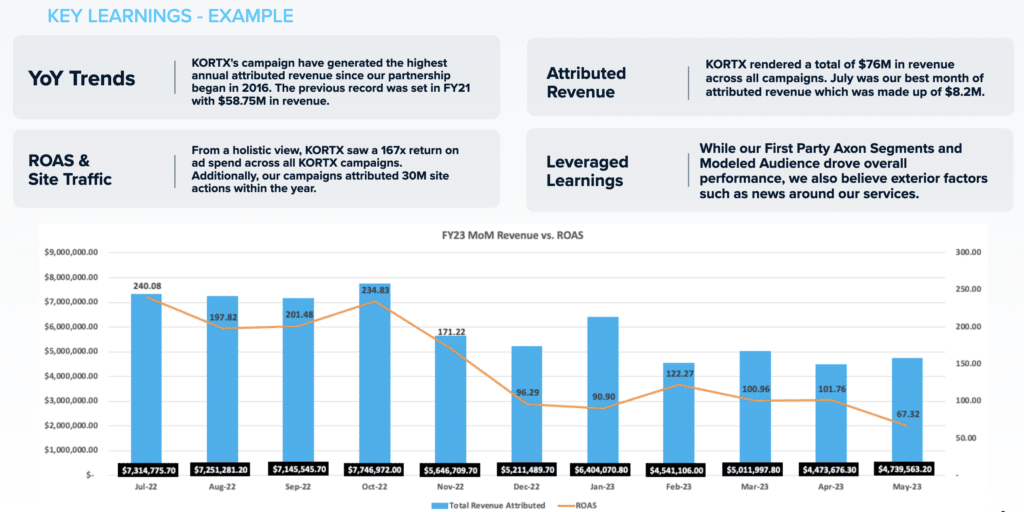
An example of an end-of-year marketing report page. This page shows YOY trends, total revenue attributed to different channels, ROAS (return on ad spend), and leveraged learnings.
What are the challenges of creating an end-of-year sales and marketing report?
“When putting together an end-of-the-year report, I ensure we are telling a clear story of what we set out to do, what ultimately happened, and based on data-driven insights, what we recommend moving forward. Crafting the moving forward portion of the report is undoubtedly the most challenging part as we dig deep into the data and insights to outline opportunities, strategic recommendations, and expected outcomes. It’s also the most rewarding part of putting together year-end reports as we provide our clients with new and unique ways to achieve their business outcomes.”
Your annual marketing report is arguably the most important report you’ll compile each year, giving you a comprehensive performance overview.
Regular reporting is vital to track the progress and outcomes of ongoing campaigns, whether weekly, monthly, or quarterly. However, the end-of-year report is where all this data comes together, providing a detailed analysis of trends, successes, and improvement areas.
Consolidating sales and marketing data is instrumental in guiding future decisions and benchmarking progress against set goals.
Effective End-of-Year marketing reports emphasize how your marketing strategies and campaigns have influenced the company’s revenue and bottom line for the year.
To help you make the most of your annual reporting, we recommend including the following information:
Before launching into specific channel performance, start with a brief year overview, including YoY trends, ROAS (Return on Ad Spend), Site Traffic information, attributed revenue, and overall learnings from the reporting period.
Tools like Kampus aggregate data from various marketing campaigns and consolidate it all in one place to help you find information when building your report. Keeping your data in one place minimizes errors and offers a complete snapshot of your ROI and critical metrics, like clicks and conversions, in your reporting.
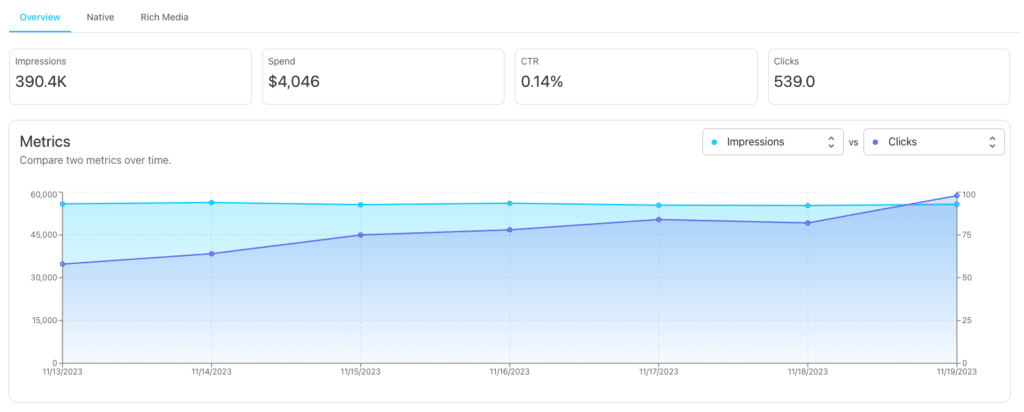
This identifies high-performing marketing tactics, strategies, top audience channels and engaged segments, and device attribution.
Break down your attribution by Top-, Middle-, and Bottom-of-the-Funnel actions. Also, compare these metrics to last year’s to reveal any wins or losses.
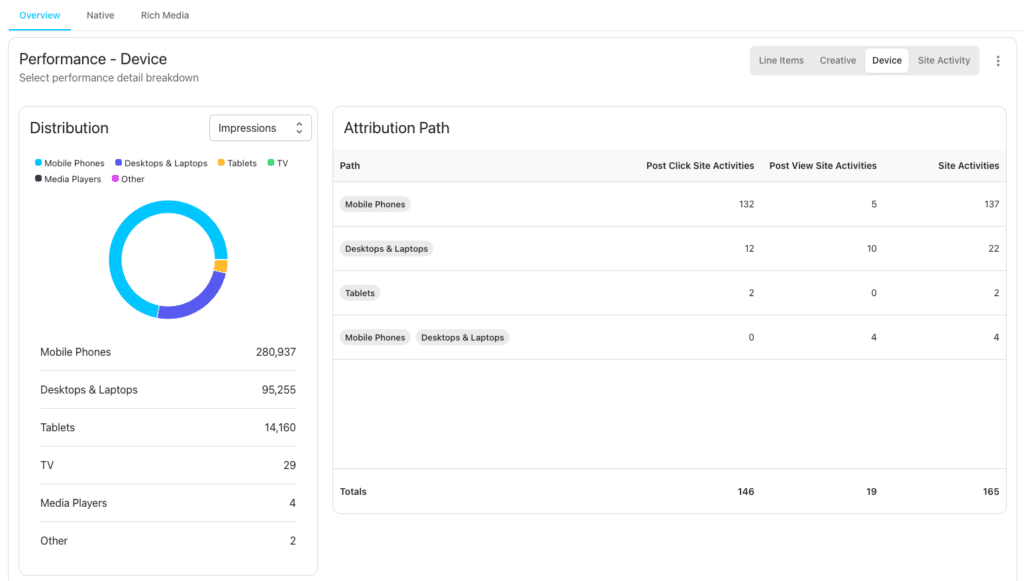
Kampus can break down attribution paths so you know exactly where your visitors go and how many site actions they take.
Expert Tip:
💡 When creating your report, evaluate performance against the previous year to account for market shifts and seasonal trends.
Next, break down each marketing channel’s performance individually to provide a detailed understanding of their contributions to your overall strategy. This section should include key metrics such as engagement rates, conversion rates, click-through rates, and any other relevant data specific to each channel.
In Kampus, you can see a detailed breakdown of each channel’s performance, including metrics like engagement rates, conversion data, impressions, and overall audience reach.
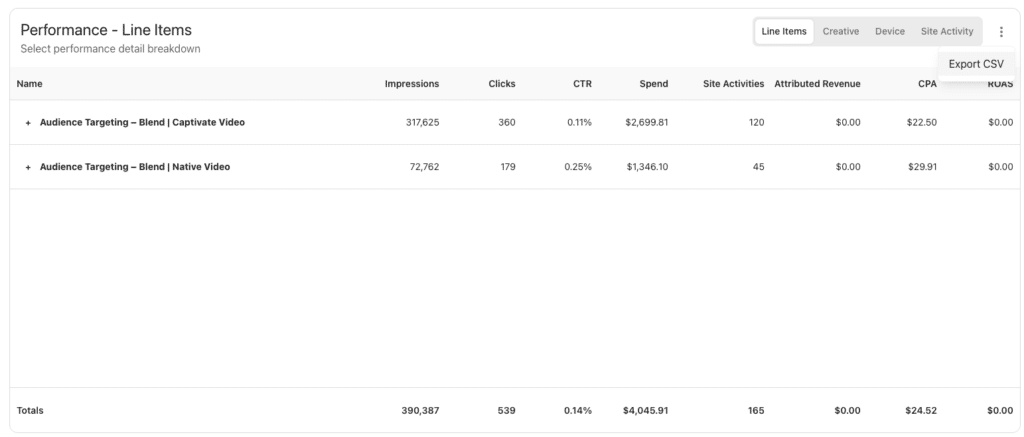
Review channel KPIs such as:
For each channel, present the data and provide analysis and insights. Discuss what the numbers mean in the context of your overall marketing objectives and how they inform future strategy.
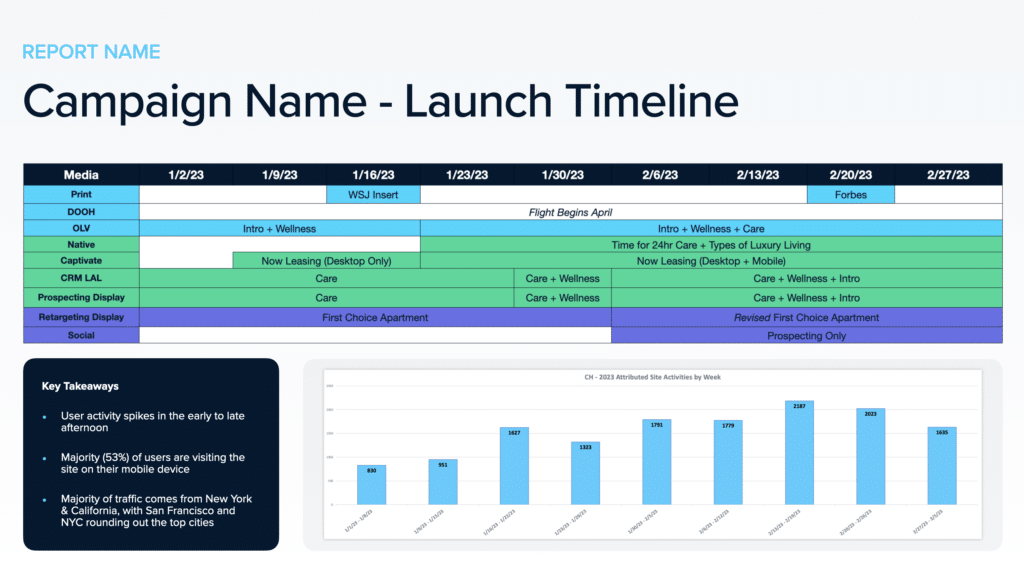
An example of breaking down each channel and including important KPIs and information based on findings.
Audience data like demographics, interests, and engagement patterns provide a deeper understanding of your target audience and how they interact with your brand.
Analyze the breakdown of age groups, gender, income levels, and other relevant demographic details that can inform targeted marketing strategies. Geographic data can reveal where your audience is concentrated and how regional variations affect outcomes.
We typically include Axon Audience Manager in our reporting to gather and analyze detailed First-Party customer data for advanced audience management and targeted marketing. Axon can break down events by device type, analyze site traffic patterns, reveal geographic location and engagement, and offer detailed profiles of the types of people engaging with your website.
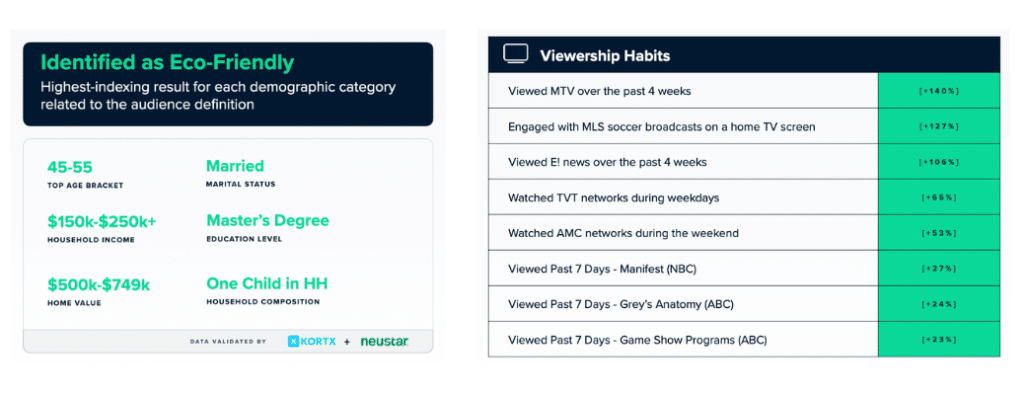
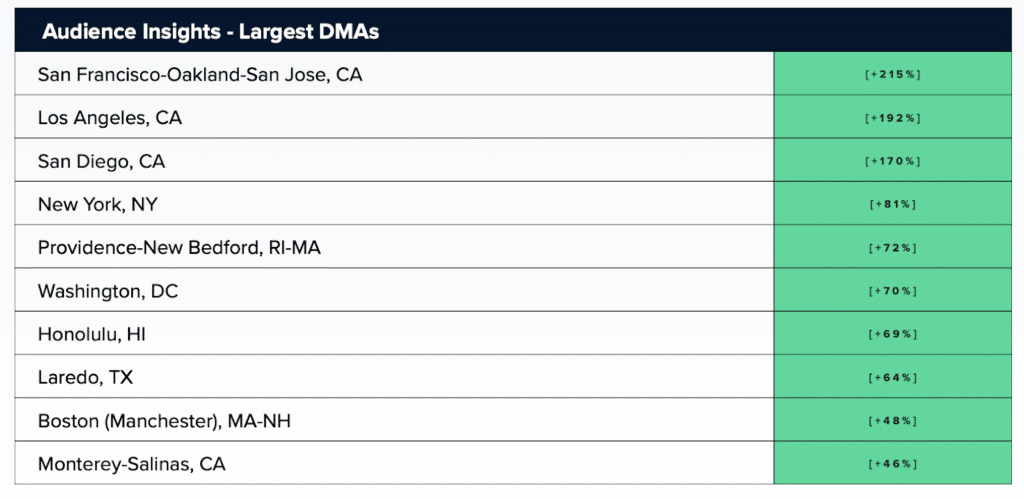
Personalize your customer experiences and unlock unlimited combinations of First-Party audience targeting with Axon.
This section should outline a strategic plan for the upcoming year based on the successes and challenges identified in the report. Review the insights and learnings gathered to set clear objectives and goals for the coming year.
Include a roadmap for addressing areas needing improvement and capitalizing on successful tactics. Discuss how new market trends and audience insights will shape your marketing approach and identify potential areas for improvement.
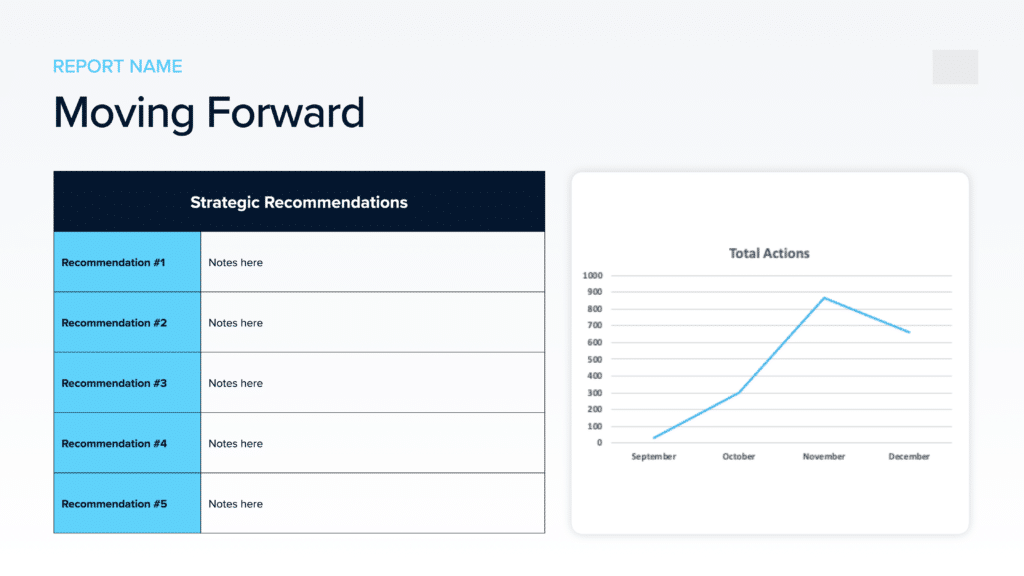
Aggregate and analyze data from your various marketing campaigns with Kampus. Kampus provides a comprehensive overview of your marketing efforts, making it easier to review year-long performance. By automating the data collection process, Kampus saves valuable time that would otherwise be spent manually gathering data from multiple sources.
Kampus can also integrate with Google Looker Studio, making it easy to create custom dashboards. Gain a complete view of your campaign’s performance across various channels, all in one platform.
Pay attention to how your strategies have evolved over the past year. Compare current performance to the previous year to understand market shifts and seasonal impacts on your campaigns.
Example: Imagine running an e-commerce store and noticing a 30% increase in December sales compared to the previous year. This year-over-year trend reveals the holiday season’s significant impact and prompts you to allocate more of your advertising budget during the holiday season.
Why is an end-of-the-year marketing report important?
“Understanding year-over-year trends is key in recognizing how seasonal and market changes impact business performance. Activating specific media sources and adjusting budgets can significantly influence these trends. A comprehensive annual report that compares the same months in different years, like June 2024 to June 2023, provides a clearer and more accurate reflection of a business’s progress and considers a multitude of influencing factors.”
While focusing on detailed metrics is important, always relate them back to the primary business goals and objectives. Ensure that the report aligns with and supports the overarching business strategy.
For instance, if your goal is to expand into new markets, your marketing strategies should be geared towards increasing brand awareness and customer acquisition in those specific regions. By keeping the big picture in mind, you can avoid getting lost in the details and focus on achieving your broader business goals.
Not all stakeholders have the same technical expertise or interest in granular details, so tailoring your reports to their needs is key. Differentiate between comprehensive data needed for a report written for internal teams and ones written for C-level executives.
Here are some of our customization tips:
Example: Creating a report for the internal marketing team may delve into specific campaign details, audience insights, and content analysis, whereas the C-suite report might focus on the marketing team’s financial impact, strategic alignment, and ROI projections.
Why should marketers tailor their end-of-year reporting?
“Marketers often sell themselves short by over-focusing on metrics from their customer relationship management or analytics tools. While these are important, non-marketers are more interested in bottom-line results. Track and report (in dollars) the growth that marketing generates—and see if that doesn’t get you a bigger budget next year. If you can’t, get together with sales to include those qualitative notes in your report.”
Use the insights from the current year to set goals and strategies for the following year. This should include adjustments based on the successes and challenges identified in the report. For example, if your report analysis reveals that social media marketing efforts resulted in significant engagement and conversions, the marketing team might decide to allocate more budget to social platforms in the next year’s marketing plan.
With this forward-thinking approach, marketing strategies remain agile and aligned with your evolving business goals.
Year-end reports enable marketing teams to view campaign performance and assess how their strategies evolved over the year. These reports provide valuable insights into what worked and what didn’t, helping teams make data-driven decisions to refine their approach for the next fiscal year.
Collaborate with our Analytics team for custom reports aligned with your goals using our new comprehensive marketing platform, Kampus.
Jeff Israel is the Director of Analytics at KORTX.
From us to your inbox weekly.